


TL;DR:
- Energy cash yield should be benchmarked against the 10-year Treasury, requiring a premium of 300 to 400 basis points.
- Investors must verify metrics such as FCF yield on enterprise value, model IRR with tax benefits, and demand P90 production estimates before committing capital.
Evaluate energy cash yield by prioritizing free cash flow (FCF) yield on an enterprise value basis, cash-on-cash return, and tax-adjusted IRR — then benchmark all three against the 10-year Treasury (~4.3% in early 2026). A project that clears 4.3% FCF yield with no growth is barely breaking even against a risk-free alternative; you need a meaningful spread above that to compensate for leverage, illiquidity, and merchant price risk.
Before committing capital, run these checks:
- Confirm FCF yield is calculated on enterprise value, not equity alone
- Verify cash-on-cash uses normalized maintenance capex, not deferred spending
- Model IRR with and without first-year tax deductions (IDC, bonus depreciation)
- Demand a P90 production estimate, not just P50
- Check distribution coverage ratio (target above 1.2x for levered deals)
- Identify any undisclosed related-party fees or sponsor promotes
Stop the deal immediately if: the yield is supported only by P50 projections, coverage falls below 1.0x, or the operator cannot produce an audited O&M history and maintenance capex schedule.
Table of Contents
- What does “cash yield” actually mean for energy investments?
- How to calculate cash yield: a worked example with sensitivity
- What operational factors actually move real-world cash yield?
- How leverage and fees change what you actually receive
- U.S. tax considerations that change your effective yield
- Red flags and the diligence checklist that protects your yield
- The practical due diligence sequence
- How to stress-test yields before you commit
- What to expect on timeline, fees, and liquidity
- When is a cash yield attractive — and when should you walk?
- Key Takeaways
- What Fieldvest looks for when vetting energy deals
- Access vetted energy deals with tax documentation built in
- Useful sources for deeper technical checks
What does “cash yield” actually mean for energy investments?
“Cash yield” is not a single metric. For direct energy investments, it covers four distinct measures, and conflating them is where most investors go wrong.
- FCF yield (EV basis): Free cash flow divided by enterprise value. This is the cleanest comparator to the Treasury rate because it strips out leverage distortions. Three adjustments materially change the result: remove stock-based compensation, separate maintenance from growth capex, and normalize working capital swings.
- Cash-on-cash return: Annual distributions divided by equity invested. Useful for sizing income against your check, but sensitive to how much debt is in the deal.
- Distribution yield: Annual distribution per unit divided by unit price or NAV. Common in midstream and MLP structures; watch coverage ratios closely.
- Levered equity IRR (tax-adjusted): Folds in the timing of tax benefits, depreciation, and terminal value alongside cash distributions. Both IRR and cash-on-cash must be modeled — IRR can look strong on paper while early cash-on-cash is thin, or vice versa.
Energy sector FCF yields have historically run higher than the S&P 500 average, with sector medians often in the 7–8% range. That premium exists for a reason: commodity cyclicality, capital intensity, and illiquidity all demand compensation.
How to calculate cash yield: a worked example with sensitivity
Take a hypothetical 5 MW contracted solar project:
- Gross revenue (P50): $1,200,000/year at a fixed PPA rate
- O&M and maintenance capex (normalized): $280,000/year
- Debt service (50% LTV, 6.5% interest): $195,000/year
- FCF to equity: $725,000/year
- Equity invested: $5,000,000; Total project cost (EV): $10,000,000
FCF yield (EV basis): $1,200,000 − $280,000 = $920,000 ÷ $10,000,000 = 9.2% Cash-on-cash: $725,000 ÷ $5,000,000 = 14.5%
After applying bonus depreciation in year one, the after-tax IRR on this structure typically improves by several percentage points — modeled separately below.

Sensitivity table
| Scenario | FCF Yield (EV) | Cash-on-Cash | Coverage Ratio |
|---|---|---|---|
| Base case (P50) | 9.2% | 14.5% | 1.48x |
| Merchant price −30% | — | — | 1.05x |
| Maintenance capex +50% | 7–8% | — | — |
| Interest rates +200 bps | 9.2% | — | — |
The P90 scenario uses a typical P50-to-P90 gap of roughly 7–10% of expected output, driven by irradiance variability and weather-data uncertainty. Notice how a merchant price shock hits coverage hardest — that is the scenario most operators underweight in their marketing materials.
What operational factors actually move real-world cash yield?
Accounting metrics only tell you what happened. These site-level drivers explain why yield diverges from projections:
- Capacity factor and availability: Unplanned downtime in midstream or upstream assets can cut distributions faster than any commodity price move.
- Soiling and temperature (solar): PV system design and energy yield research confirms that heat, dirt, and shade reduce actual harvested energy well below lab-condition efficiency figures. Regional soiling rates vary significantly.
- Decline curves (E&P): Upstream wells decline. A high initial yield on a new well can drop 30–50% in year two without a recompletion or infill program.
- Contract coverage vs. merchant tail: PPA-contracted cash flows use lower discount rates (reflecting certainty); merchant tail exposure is discounted at 9–14% by sophisticated buyers. The blend matters enormously for sustainable yield.
- Deferred maintenance: An operator who cuts O&M to inflate short-term distributions is borrowing from future yield. Ask for three years of actual maintenance spend versus budget.
Pro Tip: Fleet-level production data beats single-site promises every time. The DOE’s PV Fleet Performance Data Initiative aggregates nationwide plant operation data — use it as a benchmark when an operator’s site-level projections look aggressive.
How leverage and fees change what you actually receive
Debt amplifies distributions when prices hold, but it compresses your cushion when they don’t. A 50% LTV deal at 6.5% interest requires roughly $0.65 of revenue per dollar of debt just to cover interest — before maintenance, before distributions. Drop to 30% LTV and the coverage ratio on the same project improves materially, though cash-on-cash falls because you deployed more equity.
Common fee items that erode your realized cash-on-cash:
- Sponsor/acquisition fees: Typically 1–3% of project cost, paid upfront
- Asset management fees: Often 1–2% of invested equity annually
- Disposition fees: 1–2% of gross sale proceeds at exit
- Promote/waterfall: Sponsor’s carried interest above a preferred return hurdle
The math is simple but often buried: a 2% annual asset management fee on a $5M equity check costs $100,000/year — that is roughly 200 basis points off your cash-on-cash before the project earns a dollar. Model fees explicitly, not as a footnote.
Midstream coverage norms target 1.5–2.0x distributable cash flow; the MLP-era standard of 1.1–1.3x proved too thin when commodity prices moved against operators.
U.S. tax considerations that change your effective yield
For accredited investors, the after-tax IRR often tells a completely different story than the pre-tax cash-on-cash. First-year deductions from intangible drilling costs (IDC) and bonus depreciation can offset a large portion of invested capital against ordinary income in year one — which is why structuring tax-efficient energy cash flow matters as much as the headline yield.
Passive activity rules apply: For most W-2 professionals, energy investment losses are passive and can only offset passive income — unless the investment qualifies under working interest rules. Confirm the tax treatment with counsel before modeling the deduction.
Pro Tip: Always run parallel before-tax and after-tax IRR scenarios. A deal showing 10% pre-tax cash-on-cash with a $500,000 first-year deduction against a 37% marginal rate effectively returns $185,000 in tax savings in year one alone — that changes the IRR calculation significantly. Confirm the timing of deductions with a tax memo before signing.
Red flags and the diligence checklist that protects your yield
- Request P50 and P90 production reports — not just P50. Lenders require P90 for debt sizing; if an operator only provides P50, they are presenting the optimistic case.
- Pull three years of O&M history against budget. Consistent underspending on maintenance is a yield-inflation signal.
- Verify interconnection and curtailment data for renewables; curtailment risk can silently reduce output 5–15% in constrained grids.
- Check title, liens, and environmental reports — plugging and abandonment liabilities on oil & gas assets can be substantial.
- Audit related-party contracts — management agreements, O&M contracts, and equipment leases between the sponsor and affiliated entities deserve line-item scrutiny.
The single most common yield inflation tactic: presenting a high FCF yield based on P50 production and deferred maintenance capex simultaneously. Either alone is aggressive; together, they can overstate sustainable yield by 30–40%.
Red flags that should stop a deal: yield supported only by P50; high apparent FCF yield with no explanation of debt management or asset diversification; undisclosed related-party fees; merchant tail assumptions beyond year 10 with no hedge or contract.
The practical due diligence sequence
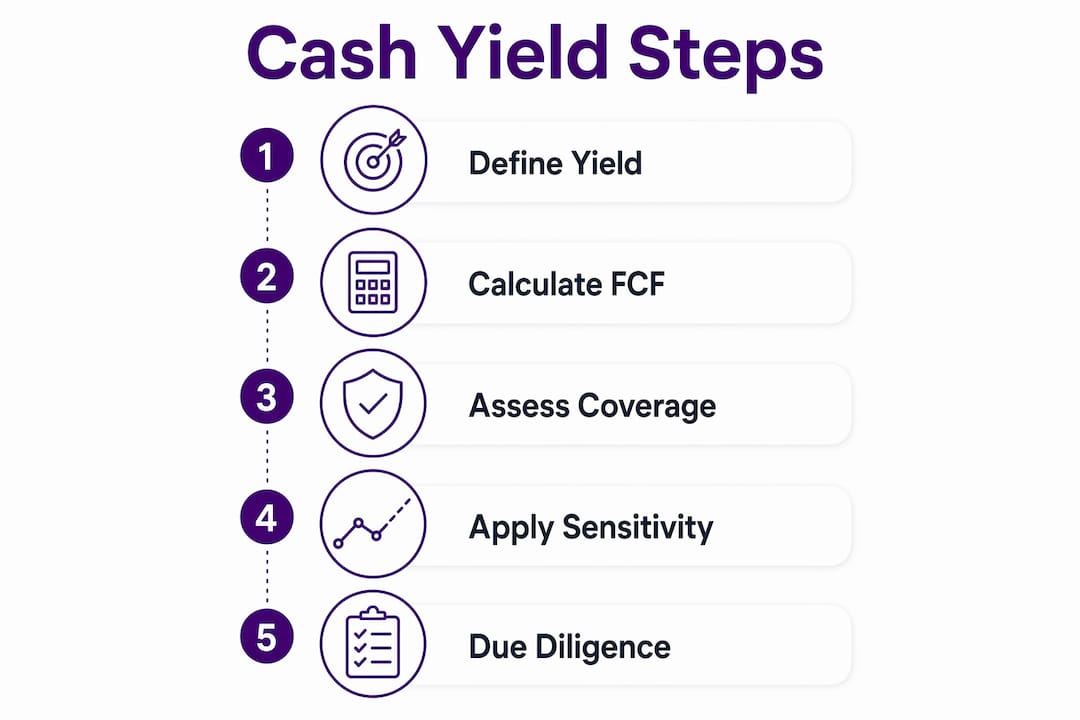
- Initial financial screen: Calculate FCF yield on EV basis, cash-on-cash, and IRR. Benchmark against the 10-year Treasury. Request the financial model.
- Technical review: Demand P50/P90 reports, site studies, and weather-data sourcing. For solar, confirm TMY files use 10–20 years of satellite records.
- Legal and title: Engage energy-specialized legal counsel to review title, liens, environmental reports, and decommissioning estimates.
- Tax memo: Have tax counsel review IDC/depletion allocations, bonus depreciation schedules, and passive activity classification.
- Sponsor track record: Request references from prior investors, audited financials from comparable projects, and the operator’s actual vs. projected performance history.
At each step, the decision checkpoint is simple: does the new information change the yield or coverage ratio materially? If yes, re-run the sensitivity table before proceeding.
How to stress-test yields before you commit
Run these four scenarios against every deal:
- Commodity price down 30%: For upstream and merchant assets, this tests whether FCF stays positive and coverage holds above 1.0x.
- P90 production realized (−8% vs. P50): Models the conservative lender case; combined uncertainty in solar typically produces a 7–10% P50-to-P90 gap.
- Maintenance capex +50%: Tests whether the operator’s O&M budget is realistic or optimistic.
- Interest rates +200 bps: Relevant for floating-rate debt or refinancing risk at exit.
For levered deals, target a P90-based coverage ratio of at least 1.0x. Below 1.0x under any single stress scenario is a structural problem, not a pricing negotiation.
What to expect on timeline, fees, and liquidity
Direct energy investments are illiquid by design. Set expectations accordingly:
- Oil & gas (E&P): First distributions often within 3–6 months of spud; hold periods typically 5–10 years depending on well performance and exit strategy.
- Contracted renewables: Construction period of 12–24 months before first distribution; hold periods of 10–20 years aligned to PPA term.
- Midstream: Fee-based cash flows can begin quickly, but asset-level exits require buyer interest in infrastructure assets.
Liquidity reality: There is no liquid secondary market for most direct energy investments. Model your cash-yield needs against a 7–10 year hold minimum. Distributions are the primary return vehicle; exit proceeds are uncertain in timing and price.
Fee drag compounds over a long hold. A 1.5% annual management fee over 10 years on a $5M equity check totals $750,000 — roughly 15% of invested capital before any performance fee. Building income-focused energy portfolios requires accounting for this drag in the IRR model from day one.
When is a cash yield attractive — and when should you walk?
Thresholds worth using:
- FCF yield (EV basis) should clear the 10-year Treasury by at least 300–400 basis points to compensate for illiquidity and commodity risk
- Cash-on-cash of 8–12% is a reasonable target range for contracted assets; upstream deals with tax benefits can justify lower pre-tax cash-on-cash
- After-tax IRR floor of 15%+ when first-year deductions are included in the model
- Coverage ratio above 1.2x under base case; above 1.0x under P90 stress
Walk away when: the yield is P50-only with no P90 disclosure; coverage falls below 1.2x at base case; the operator cannot produce audited O&M history; sponsor fees exceed 3% upfront plus 2% annually without a clear value justification; or E&P FCF yield is high only because commodity prices are at cycle peaks with no normalization applied.
Applying these thresholds to the worked example: the base-case FCF yield of 9.2% clears the Treasury spread requirement; cash-on-cash of 14.5% exceeds the target range; and coverage of 1.48x holds above 1.2x even under the P90 stress scenario. The merchant price shock scenario (coverage 1.05x) is the one that warrants a hedging conversation before closing.
Key Takeaways
Sustainable cash yield in energy investing requires benchmarking FCF yield against the 10-year Treasury, insisting on P90 production estimates, and modeling after-tax IRR before any capital commitment.
| Point | Details |
|---|---|
| Benchmark against Treasury | FCF yield (EV basis) should exceed the ~4.3% 10-year Treasury by 300–400 bps minimum. |
| Demand P90, not just P50 | P90 is the lender standard; a P50-only yield overstates sustainable production by 7–10%. |
| Model after-tax IRR first | First-year IDC and bonus depreciation materially improve IRR; always run both pre- and post-tax scenarios. |
| Watch leverage and fees | A 2% annual management fee costs ~200 bps of cash-on-cash; model all fee layers explicitly. |
| Fieldvest as your starting point | Fieldvest vets operators, provides P50/P90 reports, and structures deals with tax documentation built in. |
What Fieldvest looks for when vetting energy deals
Every deal on the Fieldvest platform goes through the same sequence this guide describes: FCF yield benchmarked against the Treasury, P90 bankability confirmed, operator track record reviewed, and tax structuring documented before a project reaches accredited investors. The transparency practices Fieldvest requires from operators — audited O&M history, maintenance capex schedules, third-party technical reviews — are non-negotiable, not optional disclosures. The goal is straightforward: give high-earning professionals the same diligence infrastructure that institutional buyers use, without requiring them to build it themselves.
Access vetted energy deals with tax documentation built in
High-earning professionals who want direct exposure to U.S. energy cash flow without assembling a diligence team from scratch use Fieldvest. The platform connects accredited investors with operators who have passed independent technical review, P90 production verification, and tax-structure documentation — so the yield math you see reflects real, normalized returns, not marketing projections.

Every deal includes deal-level tax memos, P50/P90 production reports, third-party technical reviews, and portfolio tracking tools. The first-year tax deductions available through oil and gas investments can offset a significant portion of invested capital against ordinary income — a structural advantage that pure yield comparisons miss entirely. Review current offerings and confirm your accredited investor status at Fieldvest.
Useful sources for deeper technical checks
- Photovoltaic System Design and Energy Yield | Department of Energy — Primary source for PV yield methodology, soiling/temperature loss factors, and fleet benchmarking. Best for operators and technical advisors reviewing site-level assumptions.
- Solar Yield Calculation & Energy Simulation Guide | SurgePV — Detailed P50/P90 uncertainty methodology; best for lenders and investors sizing debt on solar assets.
- Renewable Energy Valuation: Contracted Cash Flows, Merchant Tail, and Yield Frameworks | Energy IB — Explains PPA vs. merchant discount rate frameworks and IRR vs. cash-on-cash distinctions; best for analysts building financial models.
- Midstream Valuation: DCF, Yield, Coverage, and EBITDA Multiples | Energy IB — Coverage ratio norms and distributable cash flow methodology for midstream and MLP structures.
- How to Analyze Free Cash Flow Yield | DataToBrief — FCF yield adjustments (SBC, maintenance capex, working capital) and Treasury benchmarking rules of thumb; best for equity analysts and direct investors.
- E&P FCF Analysis Deep Dive | FreeCashFlow.org — Commodity cycle normalization and breakeven cost analysis for upstream assets; best for E&P diligence.
Recommended

Get the Fieldvest Energy Brief
and AI-driven demand shifts — curated for accredited investors. Smart. Strategic. Tax-advantaged.