


A credible projected-ROI analysis for a private oil and gas deal outputs one thing above all: a modeled pre-tax and after-tax IRR and NPV, paired with a cash yield, payback period, and a sensitivity range that shows what happens when oil prices or production disappoint. Anything less is a sales pitch dressed up as a model.
Before you commit capital, the sponsor’s memo needs to show you:
- Production profile (decline curve), a realistic price deck, operating costs, royalties, CAPEX, fees, and the tax elections driving IDC and depletion treatment
- Capital-call timing so you know when cash actually leaves your account
- A third-party reserve or engineering report, the operator’s audited production history, an itemized fee waterfall, and a sensitivity or Monte Carlo summary
If any of those five trust checks are missing, you’re not looking at analysis; you’re looking at a projection with no way to verify it.
Key Takeaways
A trustworthy projected-ROI analysis always pairs pre-tax and after-tax IRR/NPV with sensitivity ranges, third-party reserve verification, and a transparent fee waterfall.
| Point | Details |
|---|---|
| Compute both IRR figures | Pre-tax IRR shows raw project economics; after-tax IRR shows what IDCs and depletion actually leave you. |
| Demand a percentile range | A credible sponsor shows P10/P50/P90 outcomes from sensitivity or Monte Carlo testing, not one static number. |
| Verify tax elections independently | Have a CPA or tax attorney confirm IDC expensing, depletion method, and AMT/at-risk exposure before relying on projections. |
| Read the waterfall before the IRR | Joint venture carry structures and capital-call terms can shrink your investor-level return well below the project-level figure. |
| Match the exit assumption to your timeline | Ask whether the headline return assumes a secondary sale, a roll-up, or a hold to lease expiration. |
| Use vetted platforms to shortcut verification | Fieldvest connects accredited investors with operators offering documented production history and tax-focused due diligence support. |
Table of Contents
- How to Analyze Projected ROI Oil Deals: Core Metrics
- Step-by-Step: Building a Projected-ROI Cash-Flow Model
- Sensitivity Tables, Scenario Planning, and Monte Carlo Testing
- How U.S. Tax Rules Change After-Tax Oil ROI
- Due Diligence Checklist Before Trusting a Projected ROI
- Worked Example: Pre- and After-Tax ROI on a Single Well
- Pricing In Geopolitical and Regulatory Risk
- How Joint Venture Terms Reshape Your Allocated Returns
- Exit Strategies and Their Effect on Projected Returns
- What Actually Matters When Vetting Oil ROI Claims
- Validate Your Deal’s Tax Benefit Before You Invest
- Frequently Asked Questions
- Sources
How to Analyze Projected ROI Oil Deals: Core Metrics
Learning how to analyze projected ROI oil investments starts with knowing which numbers actually carry information and which ones just look impressive on a slide.
IRR (internal rate of return) captures the time value of money and implicitly assumes you reinvest distributions at that same rate, which rarely happens in real life. That’s why sponsors quote a single IRR while sophisticated investors ask for two: pre-tax IRR (the deal’s raw economics) and after-tax IRR (what you actually keep once IDCs and depletion hit your return).
NPV discounts every future cash flow back to today at a rate you choose, not the sponsor’s. Many accredited investors use a hurdle rate well above the sponsor’s own cost of capital to reflect illiquidity and commodity risk premiums.
- Cash yield (cash-on-cash): annual distributions divided by capital invested, the number that tells you whether this thing pays your mortgage
- Payback period: months or years until cumulative distributions equal your original investment
- Breakeven price: the oil price at which the well stops making money, arguably the single most important stress point in the whole model
Pro Tip: Ask for after-tax cash yield in year one specifically. Because intangible drilling costs and depletion can offset a large share of taxable income, a mediocre pre-tax IRR can still produce an excellent after-tax result, especially against a high W2 income.
Step-by-Step: Building a Projected-ROI Cash-Flow Model
You don’t need to be a reservoir engineer to build a working model. You need six inputs and a sequence.
- Production profile. Get the decline curve, not just a first-year rate. A well producing 200 barrels a day today might drop 60% by year two depending on formation type.
- Price deck. Use spot price, the forward strip, and at least one downside scenario pulled from historical price ranges, not the sponsor’s rosiest guess.
- Operating and lifting costs. Per-barrel cost to keep the well running, which S&P Global’s upstream KPI benchmarks can help you sanity-check against comparable projects.
- Royalties, CAPEX, and fees. Subtracted before you ever see a distribution.
- Tax elections. IDC expensing vs. capitalization, and cost vs. percentage depletion.
The calculation sequence runs: gross production → revenue → royalties → operating expenses → taxes → investor distributions → IRR/NPV. Each step trims the top-line number down to what actually lands in your account.
For a quick sanity check, a well grossing $50,000 in monthly revenue, after a 20% royalty and $12,000 in operating expenses, leaves roughly $28,000 before tax. Run that through 12 months, apply your decline curve, and you have a rough pre-tax annual cash flow before the tax layer even applies.
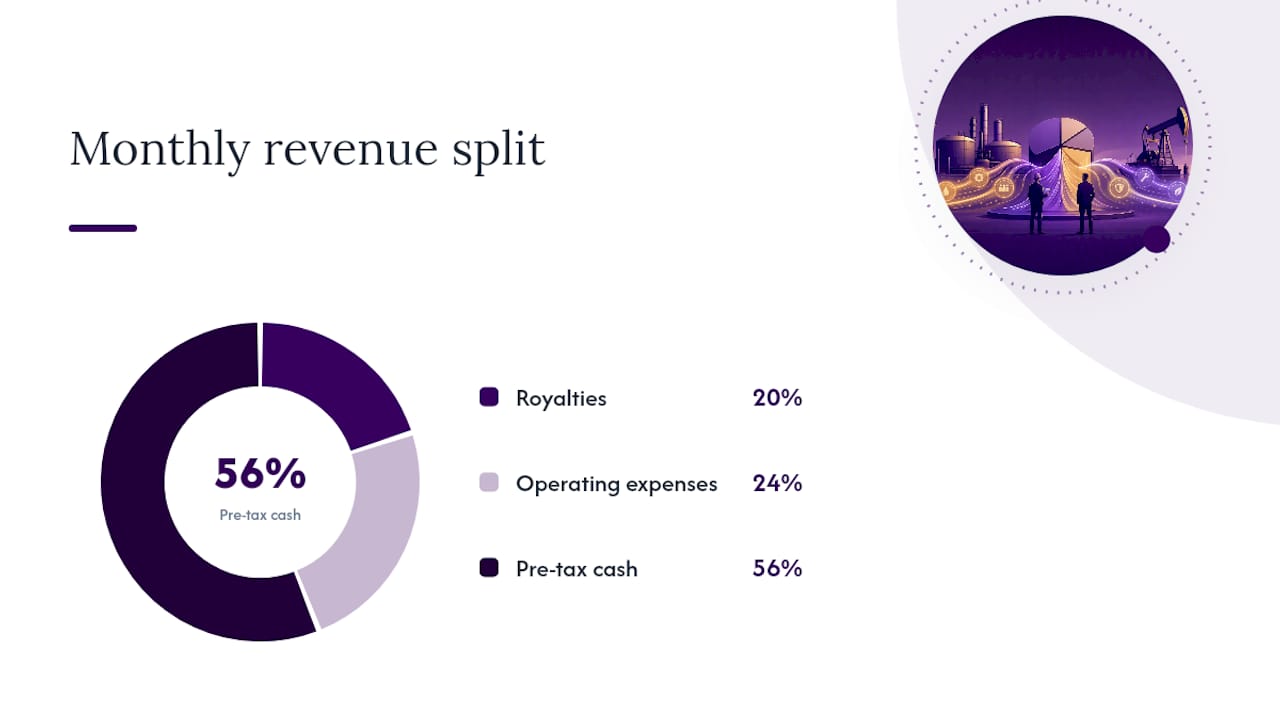
Pro Tip: Capital calls in private drilling programs rarely happen on day one. Model the actual draw schedule; treating a phased capital call as a single upfront investment understates your true IRR by ignoring the months your cash sat uninvested.
Decline-curve and price-deck modeling guidance consistently flags production and price assumptions as the two variables sponsors most often oversell.
Pro Tip: Ask whether IDCs are being expensed in year one or capitalized and amortized. The election changes your first-year tax benefit dramatically, and it should be spelled out in the deal memo, not buried in a footnote.
Pro Tip: Run the numbers with both a cost depletion and percentage depletion assumption. The better answer depends on your basis and the well’s production level, and a competent sponsor will show you both.
Sensitivity Tables, Scenario Planning, and Monte Carlo Testing
Price and initial production decline are the two levers that move projected ROI more than anything else in the model, more than fees, more than operating cost assumptions, more than almost everything combined.
A basic sensitivity table lays out IRR outcomes across a price and production grid:
For a deal you’re seriously considering, ask the sponsor to run a Monte Carlo simulation, sampling price and production distributions across thousands of iterations to produce a probability curve for IRR rather than one static guess.
The output worth asking for is a percentile spread: P10 (a pessimistic but plausible case), P50 (median expectation), and P90 (an optimistic case). A tornado chart shows you which input variable is driving the swing; a fan chart shows how wide the IRR distribution actually is.
Pro Tip: If a sponsor can’t produce a P10/P50/P90 range and instead offers only one IRR number, treat that IRR as a marketing figure, not a model output.
Similar sensitivity-modeling discipline shows up in adjacent energy sectors. Solar project financial modeling uses the same scenario-band approach to test how output variance affects investor returns, a useful cross-check if you’re comparing energy asset classes.
How U.S. Tax Rules Change After-Tax Oil ROI
Tax mechanics are where oil and gas investing genuinely diverges from most other private asset classes, and for high-earning W2 professionals, that divergence is often the entire point of the deal.
That single election can turn a modest pre-tax return into a strong after-tax one, particularly for investors sitting in a high marginal bracket.
- Depletion lets you recover part of your investment tax-free as the well produces, using either cost depletion (tied to your basis) or the statutory 15% percentage depletion available to smaller producers
- Section 469©(3) allows working-interest losses to offset active income when the interest is held without limiting your liability, a critical distinction because royalty interests generally don’t qualify for this treatment
- Entity form matters. How you hold the interest determines whether you get active-loss treatment or get stuck with passive-loss limitations that can’t touch your W2 income
Every credible model runs regular-tax and AMT calculations side by side, because large IDC deductions can trigger alternative minimum tax preference items that quietly erode the benefit you thought you’d locked in. At-risk limits and, for operating interests, self-employment tax exposure need the same scrutiny.
Pro Tip: Never rely on a sponsor’s tax illustration alone. Have your CPA or a tax attorney confirm the IDC election, depletion method, and at-risk treatment before you wire funds, and read Fieldvest’s breakdown of how oil and gas investments lower taxable income for the mechanics in plain language.
Due Diligence Checklist Before Trusting a Projected ROI
A polished deck means nothing if the underlying assumptions can’t be verified. Before you accept any sponsor’s projected ROI, confirm:
- A third-party reserve or engineering report backing the production forecast
- Audited operator production history on comparable wells, not just marketing claims
- Clean title and land ownership documentation
- A fully itemized fee and waterfall schedule, showing exactly how distributions split between you and the sponsor
- Current insurance and permits in place before drilling begins
Watch for these red flags, which show up more often than investors expect:
- Vague decline-curve assumptions with no supporting data
- An operator history that can’t be independently verified
- An opaque fee waterfall that buries carried interest inside “administrative costs”
- No reserve audit anywhere in the offering documents
- Unlimited or undefined future capital-call obligations
If a sponsor resists producing sensitivity outputs or documentation for an optimistic production number, that reluctance is itself the answer. Fieldvest’s reserve data interpretation guide walks through how to read a reserve report line by line before you take a decline curve at face value.
Worked Example: Pre- and After-Tax ROI on a Single Well
Here’s a compact version of how the pieces fit together, using round numbers rather than any real sponsor’s claims.
- Gross year-one revenue at 60 bbl/day and $70/barrel runs roughly $1.53 million across the full well; your proportional share depends on your working-interest percentage in the drilling program.
- After the 20% royalty and $15/barrel operating cost, net revenue to the working interest shrinks meaningfully before any distributions occur.
- Applying the 10% fee and modeling the decline curve into year two produces a pre-tax IRR in a moderate double-digit range with an early cash yield, assuming the price deck holds.
- After IDC expensing offsets a large share of first-year taxable income and depletion shelters a portion of ongoing distributions, the after-tax IRR typically outpaces the pre-tax figure for high-bracket investors, at least in year one.
- Run the same model at $56/barrel (a 20% price cut) and watch the IRR compress substantially. That gap is the entire reason sensitivity analysis exists.
Pro Tip: Never take a single-scenario IRR at face value. Rebuild the sponsor’s model with your own price deck before you decide it fits your portfolio, and check the math against Fieldvest’s free tax deduction calculator to estimate your own first-year benefit.
Pricing In Geopolitical and Regulatory Risk
Not every risk fits neatly into a spreadsheet cell. Geopolitical shocks, OPEC+ production decisions, and shifting federal or state drilling regulations can all move oil prices or project economics without ever showing up in a decline curve.

The practical approach is to convert these qualitative risks into quantitative haircuts. If a project sits in a basin facing a pending regulatory change (a new emissions rule, a permitting slowdown), apply a discount-rate premium of a percentage point or two above your standard hurdle rate rather than ignoring the risk entirely. That premium compresses NPV proportionally to how uncertain the outcome really is.
For geopolitical risk, widen your price-deck downside scenario. If a meaningful share of global supply runs through a region prone to disruption, your severe-downside case should already assume a price spike, not just a price drop, since geopolitical shocks can push oil prices in either direction depending on which side of the supply chain gets disrupted.
Regulatory risk at the state level deserves its own line item too. Severance tax changes, flaring restrictions, and water-disposal rules vary significantly by basin, and a sponsor operating in Texas faces a different regulatory calculus than one operating in a state with a more restrictive drilling posture. Ask the sponsor directly how a plausible regulatory change in their operating basin would affect the breakeven price, and treat a vague answer as a gap in the model, not a minor omission.
How Joint Venture Terms Reshape Your Allocated Returns
The IRR in a sponsor’s deck almost always describes the project’s raw economics, not what you personally receive after the partnership agreement splits the pie. That distinction trips up more investors than any single production assumption.
Most private oil and gas deals run through a joint venture or limited partnership structure with a distribution waterfall: return of capital first, then a preferred return to investors, then a carried-interest split favoring the sponsor once returns clear a hurdle. A deal advertising a 25% project-level IRR might deliver an investor-level IRR several points lower once the carry kicks in above the preferred return threshold.
Read the waterfall provisions before you read anything else in the partnership agreement. Look specifically at how capital calls are handled if a follow-on well needs funding, whether non-participating investors get diluted, and how the general partner’s fee accrues, whether it’s charged against gross revenue or net distributions changes your allocated return meaningfully.
Liability exposure also depends on the structure. A working interest held through certain non-limiting arrangements can qualify for active-loss treatment under Section 469©(3), while the same economic interest held through a limited partnership interest generally cannot. The legal form of your participation, not just the underlying well economics, determines a real slice of your after-tax return.
Exit Strategies and Their Effect on Projected Returns
A projected ROI that assumes you hold to full depletion is a different animal than one that assumes an earlier exit, and sponsors don’t always make clear which one they’re showing you.
Three exit paths show up most often in private oil and gas deals. Secondary sales let you transfer your working interest to another investor before the well’s economic life ends, though liquidity in this market is thin and pricing depends heavily on current production data and commodity prices at the time of sale. Roll-ups into a larger entity (occasionally ahead of an IPO or acquisition by a larger operator) can accelerate returns but introduce dilution and valuation risk that a simple hold-to-depletion model doesn’t capture. Lease expiration is the default exit for many royalty and working-interest structures, where returns simply stop once the well’s economic production ends or the lease term lapses.
Ask the sponsor which exit assumption underlies their headline IRR. A model assuming a secondary sale at year five carries very different risk than one assuming a 15-year hold to depletion, even if both show the same round-number return on the cover page. Fieldvest’s overview of private oil investment cash-flow structures breaks down how hold-period assumptions change the shape of your projected distributions.
What Actually Matters When Vetting Oil ROI Claims
The number I trust least in any deal memo is a single IRR with no range attached to it. Plausible production assumptions, tax mechanics confirmed independently by a CPA or tax attorney, clean title, and a transparent fee structure matter more than any headline return figure a sponsor puts on the cover page.
On allocation: most accredited investors I’d consider well-positioned for this strategy treat it as a satellite position, a meaningful slice for the tax benefit and cash flow, not a core holding, given the illiquidity and commodity-price exposure involved.
If a sponsor won’t produce a third-party reserve report and a documented operator audit history, walk away. That’s the one check I wouldn’t skip regardless of how attractive the projected numbers look.
Validate Your Deal’s Tax Benefit Before You Invest
Fieldvest exists because most accredited investors don’t have time to rebuild a sponsor’s cash-flow model from scratch, and shouldn’t have to gamble on a headline IRR without checking the tax mechanics behind it.

Every project on the Fieldvest platform comes from vetted U.S. operators with production history and reserve documentation available for your review, not just a pitch deck. Fieldvest’s free oil and gas tax deduction calculator lets you plug in your own numbers and estimate a first-year tax benefit in minutes, before you commit a dollar. If you want the fuller picture on how IDC and depletion elections translate into after-tax cash flow, Fieldvest’s tax guide walks through the mechanics investors ask about most. Run your numbers through the calculator today and see what a vetted project could mean for your after-tax return this year.
Frequently Asked Questions
What’s a realistic IRR range for private oil and gas deals? It varies widely by project stage and risk, which is exactly why a sensitivity range matters more than any single number a sponsor quotes.
How do I know if a sponsor’s decline curve is realistic? Compare it against third-party reserve reports and comparable well data rather than accepting the sponsor’s own projection at face value.
Do royalty interests get the same tax treatment as working interests? No. Royalty interests generally don’t qualify for the active-loss exception under Section 469©(3) or the IDC deductions available to working interests.
How often should I re-run sensitivity analysis on an existing investment? Whenever the price deck shifts materially or the operator releases updated production data, typically annually at minimum.
Is a higher discount rate always more conservative? Generally yes for NPV purposes, since it demands more from future cash flows to justify today’s investment, though the right rate depends on your personal hurdle and the deal’s actual risk profile.
This article is general information, not a substitute for advice from a qualified financial advisor. Consult a qualified financial professional about your own circumstances before acting on anything here.
Sources
- Oil and Gas Investing Explained: Tax Benefits for High Earners — Cunningham Legal
- 26 U.S. Code § 469 — Limitation on losses from passive activities — Legal Information Institute (Cornell Law)
Recommended

Get the Fieldvest Energy Brief
and AI-driven demand shifts — curated for accredited investors. Smart. Strategic. Tax-advantaged.