

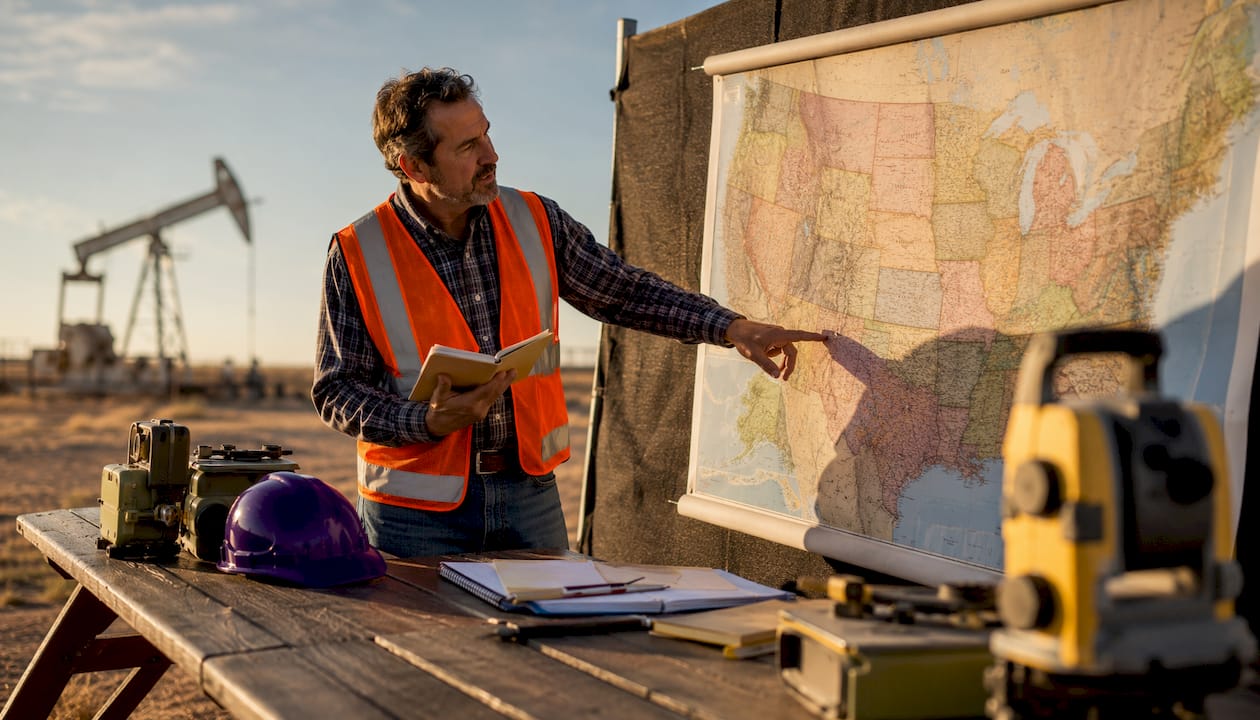
The U.S. is the world’s largest producer of both crude oil and natural gas, and 2026 marks another record year. U.S. crude oil production hit 13.6 million barrels per day in 2025, an all-time high, and natural gas is projected to reach 109 billion cubic feet per day in 2026, also a new record. The oil and gas industry in the US sits at the center of the national economy, energy security, and global energy markets simultaneously.
A few facts that frame the scale:
- Production leader: The U.S. outpaces every other country in both crude oil and natural gas output.
- Market size: The U.S. Oil and Gas Extraction industry is projected at $598.7 billion in 2026, a 19% increase driven by higher demand and price volatility.
- Top producing states: Texas, North Dakota, and New Mexico account for the majority of domestic crude output, anchored by the Permian Basin and Bakken formation.
- Technology drivers: Hydraulic fracturing and horizontal drilling unlocked vast tight oil and shale gas reserves that were inaccessible two decades ago.
- Regulatory framework: The U.S. Energy Information Administration (EIA), the Environmental Protection Agency (EPA), and the Bureau of Land Management (BLM) each govern distinct aspects of production, environmental compliance, and federal land leasing.
- Economic integration: The industry supports millions of jobs, contributes to federal and state tax revenues, and underpins manufacturing, transportation, and national security.
The oil and gas industry in the USA is not a single monolithic sector. It spans exploration, drilling, pipeline transport, refining, and export, with thousands of companies ranging from global majors to small independent operators working across every link in that chain.
Where is oil and gas produced in the US?
The geographic footprint of U.S. oil and gas production is concentrated but far from uniform. A handful of states and offshore regions generate the overwhelming share of output, each tied to distinct geologic formations and production methods.
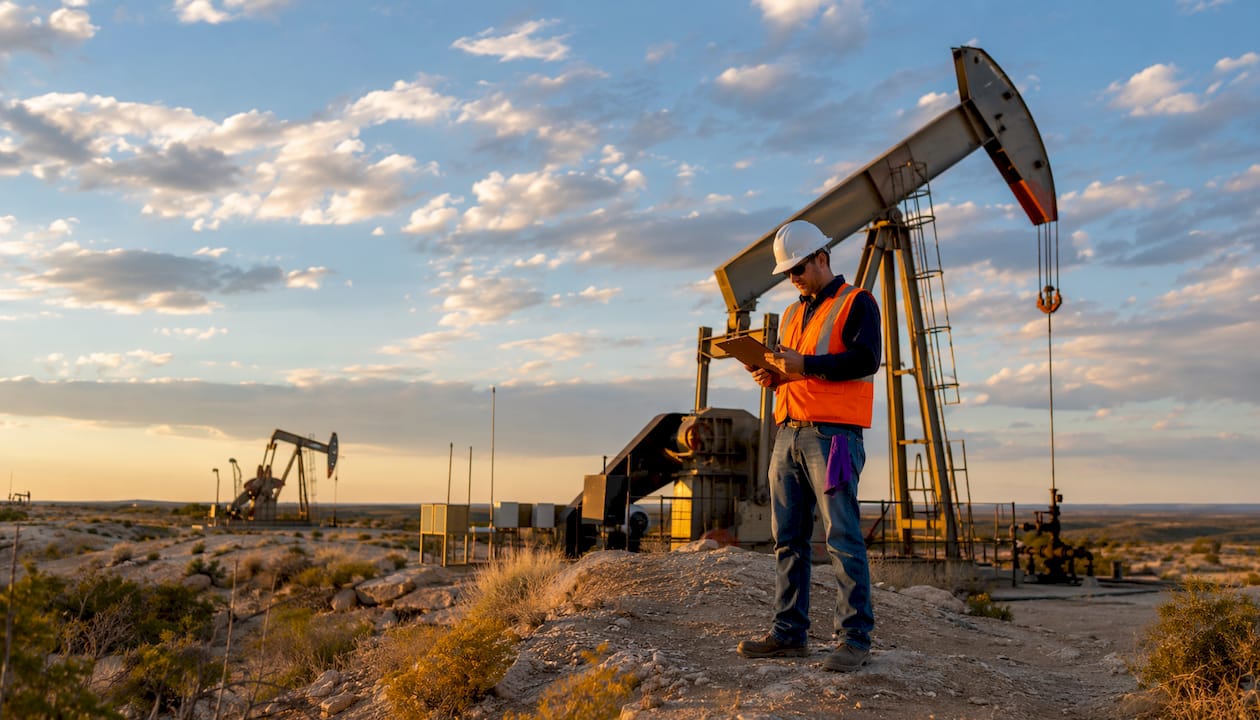
Texas leads all states in crude oil production, followed by North Dakota and New Mexico, with the Permian Basin in West Texas and southeastern New Mexico serving as the single most productive oil-producing region in the country. The Bakken formation, straddling North Dakota and Montana, transformed North Dakota from a minor producer into a top-three state over roughly fifteen years. Louisiana and Oklahoma round out the top five, with Louisiana’s output tied heavily to Gulf of Mexico activity.
| State / Region | Primary Formation | Key Resource |
|---|---|---|
| Texas | Permian Basin, Eagle Ford | Crude oil, natural gas |
| North Dakota | Bakken, Three Forks | Tight oil |
| New Mexico | Permian Basin (Delaware sub-basin) | Crude oil, associated gas |
| Louisiana | Gulf of Mexico offshore | Crude oil, natural gas |
| Oklahoma | SCOOP, STACK plays | Natural gas, crude oil |
| Gulf of Mexico (Federal) | Deepwater fields | Crude oil, natural gas |
The Gulf of Mexico offshore fields deserve separate attention. Federal offshore production in the Gulf accounts for a meaningful share of total U.S. crude output and operates under a different regulatory and logistical structure than onshore plays. Deepwater platforms like those in the Tiber and Jack/St. Malo fields produce from reservoirs miles beneath the seafloor, requiring technology and capital that only the largest operators can deploy.
A few distinctions worth understanding:
- Conventional vs. unconventional: Conventional fields, common in older Gulf Coast and Midcontinent plays, rely on natural reservoir pressure. Unconventional plays, which now dominate new U.S. production, require hydraulic fracturing and horizontal drilling to release oil and gas from low-permeability rock.
- Associated gas: Much of the natural gas produced in Texas and New Mexico comes up alongside crude oil as a byproduct. Managing and monetizing that associated gas, rather than flaring it, has become a priority for both operators and regulators.
- Tight oil formations: The EIA tracks notable tight oil formations including the Bakken and Three Forks in the Williston Basin, the Spraberry, Wolfcamp, and Bone Spring in the Permian, and the Eagle Ford along the Gulf Coast. These formations now drive the majority of new U.S. production growth.
The U.S. produces mostly light, sweet crude oil from these unconventional plays, but still imports heavier, higher-sulfur crude grades to feed refineries on the Gulf Coast that were originally built to process imported heavy oil. That mismatch between domestic production quality and refinery configuration shapes both import volumes and crude pricing.
How the U.S. petroleum industry is structured
The petroleum industry in the U.S. divides into three broad segments, each with its own companies, economics, and regulatory exposure. Understanding the structure clarifies why the industry behaves the way it does during price swings and policy shifts.
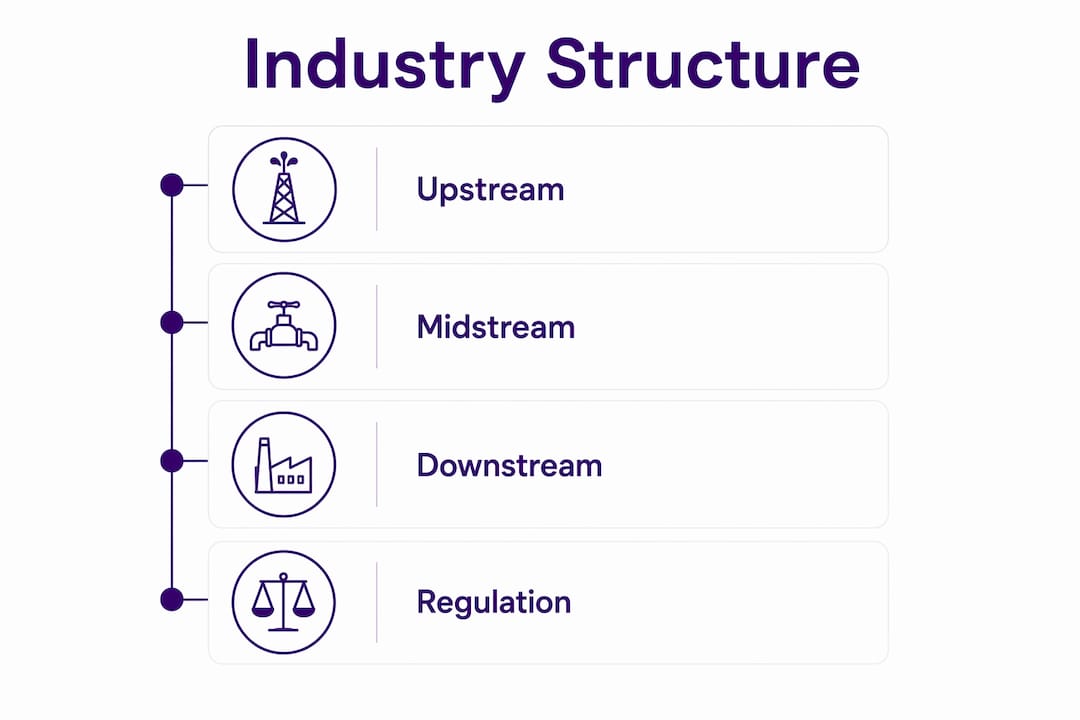
Upstream covers exploration and production. This is where geologists identify prospects, drilling rigs sink wells, and operators bring oil and gas to the surface. The upstream segment includes both major integrated companies and independent producers. Independents, which focus exclusively on exploration and production rather than refining or retail, actually account for the majority of U.S. drilling activity. They tend to move faster on new plays and carry more concentrated commodity price risk.
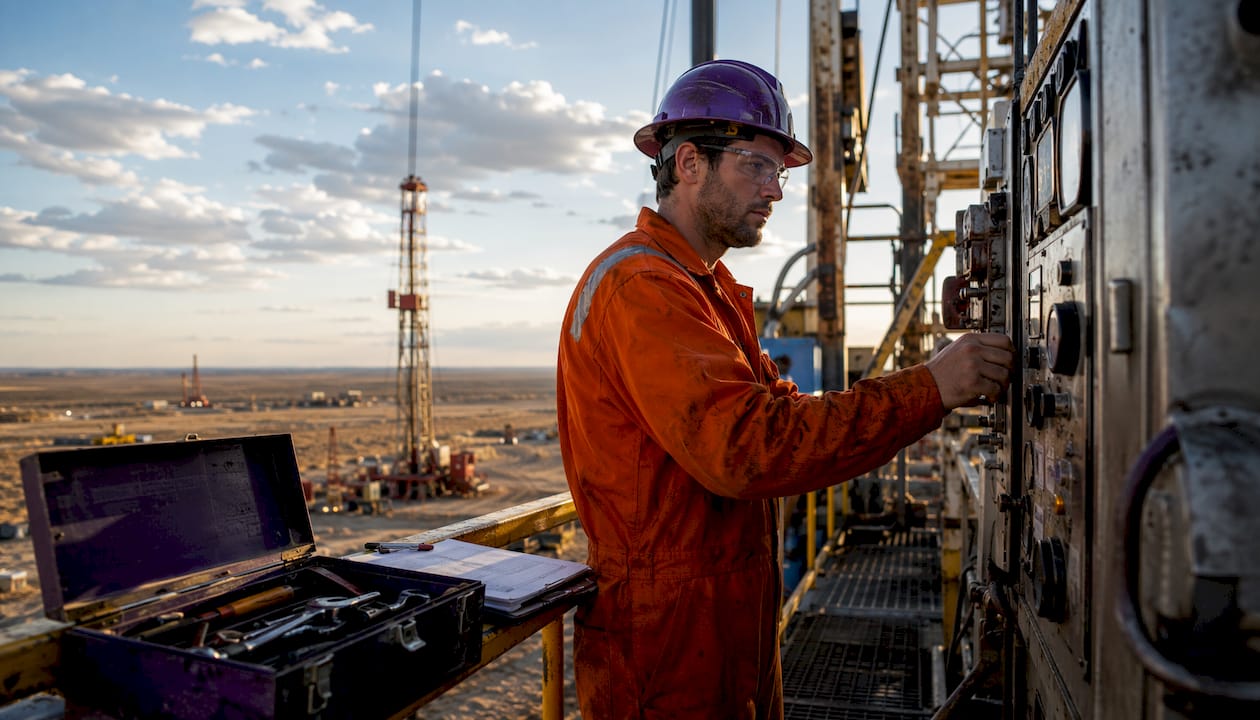
Midstream handles transportation and storage. Pipelines, gathering systems, processing plants, and storage terminals all fall here. Midstream companies typically operate on fee-based contracts, insulating them somewhat from crude price volatility. The network connecting Permian Basin wellheads to Gulf Coast export terminals runs through this segment.
Downstream encompasses refining, petrochemicals, and marketing. Refineries convert crude oil into gasoline, diesel, jet fuel, and feedstocks for plastics and chemicals. Major integrated companies like ExxonMobil and Chevron operate across all three segments, while most independents stay upstream.
The industry’s structural composition also includes a large service sector. Companies providing drilling rigs, completion services, pressure pumping, and well maintenance support every upstream operator without taking direct commodity exposure. Service companies tend to be early indicators of industry activity: when rig counts rise, service demand follows within weeks.
From a classification standpoint, the Bureau of Labor Statistics places oil and gas extraction under NAICS 2111, which covers crude petroleum production, natural gas extraction, oil shale and oil sands mining, and sulfur recovery from natural gas. Employment in this subsector concentrates heavily in Texas, Oklahoma, and North Dakota, reflecting where the wells are.
The oil and gas industry’s economic reach extends well beyond the wellhead. According to the American Petroleum Institute’s analysis of the industry’s contribution to the U.S. economy in 2023, the sector supports millions of jobs and generates economic activity across manufacturing, construction, transportation, and finance, with ripple effects that touch virtually every sector of the U.S. economy.
Regulatory oversight cuts across all three segments. The EPA sets environmental standards for air emissions, water discharge, and waste management at production sites. The BLM administers leasing and permitting on federal lands, which cover a substantial portion of western U.S. acreage. The Federal Energy Regulatory Commission (FERC) regulates interstate pipeline rates and access. State agencies, such as the Texas Railroad Commission and the North Dakota Industrial Commission, handle permitting and production reporting at the state level.
How oil and gas extraction actually works in the U.S.
The technical story of U.S. oil and gas production over the past two decades is essentially the story of two technologies: horizontal drilling and hydraulic fracturing. Together, they turned formations that were known to contain oil and gas but considered uneconomic into the most productive plays in the world.
Horizontal drilling allows multiple wells to be drilled from a single surface location, or well pad, reaching out laterally through a target formation for a mile or more. This dramatically reduces surface disturbance compared to drilling one vertical well per location. A single pad in the Permian Basin might support eight to twelve horizontal wells fanning out in different directions, each accessing a different zone of the same rock.
Hydraulic fracturing then breaks up the low-permeability rock that horizontal wells penetrate. Water, chemicals, and sand are pumped down the well under high pressure, cracking the shale or tight sandstone and propping those cracks open so oil and gas can flow. Without fracturing, a horizontal well in the Wolfcamp or Bakken would produce almost nothing. With it, initial production rates can run into the thousands of barrels per day.
The production cycle from exploration to first oil typically follows this sequence:
- Geologic assessment: Seismic surveys and subsurface mapping identify target formations.
- Leasing: Operators acquire mineral rights or federal leases on prospective acreage.
- Drilling: A rig drills the vertical section, then curves to horizontal through the target zone.
- Completion: Hydraulic fracturing stages are pumped along the lateral to stimulate production.
- Production: Oil and gas flow to surface facilities for separation, measurement, and gathering.
- Water management: Produced water, which comes up with oil and gas in large volumes, is either recycled for future fracturing operations or disposed of in injection wells.
Pro Tip: Unconventional wells decline steeply in their first year, often losing 60–70% of peak production. Operators offset this by continuously drilling new wells, which means capital spending never really stops in active shale plays.
Associated natural gas production has grown alongside crude output, particularly in the Permian Basin where associated gas production tripled between 2018 and 2023 in the top three Permian oil plays. Managing that gas, building pipeline takeaway capacity, and reducing flaring has become one of the industry’s central operational challenges.
Environmental impacts tied to extraction include methane emissions from wellheads and gathering systems, water use and disposal in water-scarce regions like the Permian, and surface disturbance from roads, pads, and pipelines. Regulatory pressure on methane emissions has intensified, with the EPA’s methane rules under the Clean Air Act requiring operators to detect and repair leaks across their production infrastructure.
How crude oil moves from the wellhead to market
Getting oil from a wellhead in West Texas or North Dakota to a refinery or export terminal involves a layered transportation network of pipelines, barges, rail, and trucks. Each mode plays a specific role depending on geography, volume, and destination.
Pipelines carry the vast majority of crude oil in the U.S. They are the cheapest per-barrel option for large volumes over long distances and form the backbone of the system connecting producing basins to refining centers. The Permian Basin feeds into a dense web of pipelines running to Cushing, Oklahoma (the primary U.S. crude pricing hub) and directly to Gulf Coast refineries and export terminals at Corpus Christi and Houston.
Barges move crude and refined products along inland waterways, particularly on the Mississippi River system and along the Gulf Coast. They are slower than pipelines but provide flexibility where pipeline infrastructure is absent.
Rail became critical during the shale boom when pipeline capacity in the Bakken lagged production growth. Unit trains carrying crude from North Dakota to East and West Coast refineries became common from roughly 2012 through 2015. Rail remains a backup option when pipelines are constrained or when producers need to reach refineries not served by pipe.
Trucks handle short-haul gathering, moving crude from wellheads to nearby pipeline injection points or local storage. In areas where gathering infrastructure is still being built, trucks are often the first transportation solution.
| Transportation Mode | Primary Use | Key Advantage |
|---|---|---|
| Pipeline | Long-haul, high volume | Lowest cost per barrel |
| Barge | Inland waterways, coastal | Flexible routing |
| Rail | Basin-to-refinery when pipeline constrained | Reaches non-pipeline markets |
| Truck | Wellhead to gathering point | No fixed infrastructure needed |
The Strategic Petroleum Reserve (SPR), stored in salt caverns along the Gulf Coast in Texas and Louisiana, represents the U.S. government’s emergency crude stockpile. After a 180-million-barrel drawdown in 2022 under the prior administration, the Department of Energy began refilling the SPR in late 2025, awarding contracts for deliveries from the Bryan Mound site starting in December 2025 through January 2026.
Pricing at the wellhead and at refineries reflects both transportation costs and quality differentials. Crude produced in the Permian trades at a discount to West Texas Intermediate (WTI) at Cushing when pipeline capacity is tight, then narrows when new pipes come online. Export terminals on the Gulf Coast now ship U.S. crude to buyers in Europe and Asia, connecting domestic production directly to global benchmark prices.
What does the U.S. oil and gas sector mean for the economy?
The oil and gas industry’s economic footprint runs far deeper than the energy sector alone. The industry supports millions of jobs with major employment concentrations in Texas, Oklahoma, and North Dakota, but the indirect effects reach manufacturing, construction, finance, and professional services across every state.
The market size figure tells part of the story. At a projected $598.7 billion in 2026, the extraction segment alone ranks among the largest industries in the U.S. economy. That figure does not include midstream, downstream refining, or the broader petrochemical sector, all of which add substantially to the total economic contribution.
| Economic Indicator | Detail |
|---|---|
| 2026 market size (extraction) | $598.7 billion projected |
| Crude oil production (2025) | 13.6 million barrels per day |
| Natural gas production (2026 projected) | 109 billion cubic feet per day |
| LNG exports authorized (2025) | More than 17.6 Bcf/d |
LNG exports have become a major growth driver. The U.S. became the world’s top LNG exporter, and the Department of Energy authorized more than 17.6 Bcf/d of LNG exports in 2025, a volume more than 70% greater than what the world’s second-largest LNG supplier exports today. Long-term supply agreements, like JERA’s commitment to purchase up to 5.5 million tonnes per year through 20-year off-take deals, lock in demand and support capital investment in new liquefaction capacity.
Pro Tip: State-level production data from the EIA is often released years after extraction occurs. Investors and analysts relying on granular well-level data should account for this lag when assessing current production trends, using national aggregates as the more timely leading indicator.
The industry’s growth trajectory faces real headwinds alongside the tailwinds. Price volatility remains the central risk: a sharp drop in WTI can stall drilling programs within a quarter, since most shale operators need prices above a certain threshold to justify new well completions. Environmental regulations, particularly around methane emissions and produced water disposal, add compliance costs that fall disproportionately on smaller independent operators. The ongoing shift toward unconventional production requires continuous capital investment in new wells to offset steep decline curves, creating a treadmill dynamic where spending must remain high just to hold production flat.
For investors watching U.S. energy market trends, the combination of record production, expanding LNG export capacity, and a supportive federal regulatory posture in 2025 and 2026 creates a different risk-reward profile than the industry carried five years ago. The structural shift from import dependence to export dominance has changed how domestic prices respond to global supply shocks, and that matters for anyone with exposure to energy assets.
The industry’s economic ripple effects extend to sectors that don’t look like energy at all. Steel mills that supply casing and tubular goods, chemical plants that process natural gas liquids, engineering firms that design offshore platforms, and banks that finance drilling programs all depend on oil and gas activity levels. When rig counts fall, those effects propagate quickly through supply chains in Texas, Pennsylvania, and beyond.
Accredited investors looking to participate directly in U.S. oil and gas production can access vetted energy projects through Fieldvest, which connects high-earning professionals with operators offering first-year tax deductions and long-term production income. The tax benefits tied to oil and gas investments remain among the most favorable in the U.S. tax code, including intangible drilling cost deductions that can offset a large share of invested capital in year one.

Key Takeaways
The U.S. oil and gas industry in 2026 is the world’s largest producer of both crude oil and natural gas, with record output driven by unconventional extraction technologies and a $598.7 billion market projected for the extraction segment alone.
| Point | Details |
|---|---|
| Record production levels | U.S. crude oil hit 13.6 million barrels per day in 2025, a record high, and natural gas is projected to reach 109 billion cubic feet per day in 2026, also a new record. |
| Geographic concentration | Texas, North Dakota, and New Mexico lead output, anchored by the Permian Basin and Bakken formation. |
| Industry structure | Upstream, midstream, and downstream segments each carry distinct economics, risks, and regulatory exposure. |
| LNG export growth | The U.S. became the world’s top LNG exporter, with over 17.6 Bcf/d authorized in 2025. |
| Investor opportunity | Oil and gas investments offer first-year tax deductions and long-term cash flow for accredited investors. |
Recommended

Get the Fieldvest Energy Brief
and AI-driven demand shifts — curated for accredited investors. Smart. Strategic. Tax-advantaged.