


TL;DR:
- U.S. shale reserves offer tax-advantaged cash flow opportunities, but deal quality depends on operator track record and basin choice.
- Investors should verify reserve figures, well economics, and DUC inventory while understanding resource terminology and technology trends.
U.S. shale reserves represent one of the most accessible tax-advantaged cash-flow opportunities available to accredited investors today, but the quality of a specific deal depends almost entirely on operator track record, basin selection, and how well the reserve figures in the sponsor package hold up against EIA and SEC data. Before you commit capital, two things matter most: whether the project sits in a proven tight-oil play (not oil shale, which is a completely different and largely uncommercial resource), and whether the operator’s well-level economics survive a $10–15/bbl price stress test.
- Shale plays account for ~60% of U.S. crude oil proved reserves as of year-end 2024, with total proved reserves growing from 26.2 to 27.5 billion barrels.
- Your first move: request the operator’s well-level EUR assumptions, IP30 data, and the most recent SEC reserve disclosure before reviewing any pro forma.
Table of Contents
- What the key U.S. shale reserve numbers actually mean for you
- How reserve figures translate into project cash flow and tax timing
- Which U.S. shale basins matter most for investor returns
- Technology trends that change what your wells actually recover
- How to read reserve disclosures and spot reporting gaps
- Tax considerations accredited investors should verify with a CPA
- Due-diligence checklist before you wire capital
- A simplified shale investment example
- Key Takeaways
- Why operator vetting matters more than headline reserve numbers
- Vetted shale opportunities through Fieldvest
- Useful sources and next reads
What the key U.S. shale reserve numbers actually mean for you
The terminology in sponsor materials can obscure more than it reveals. Here are the definitions that matter, alongside the sources you should use to verify them.
Proved reserves (1P) are volumes a company can recover with reasonable certainty under current prices and technology. Proved undeveloped reserves (PUDs) are a subset that require future capital to drill. Technically recoverable resources (TRR) are a much larger, price-agnostic estimate from agencies like the USGS and EIA. Estimated ultimate recovery (EUR) is the per-well figure operators use to build cash-flow models. None of these are interchangeable, and sponsors who blur the lines between TRR and proved reserves are waving a red flag.
One distinction the USGS draws sharply: “oil shale” (kerogen-bearing rock requiring industrial retorting at 450–500°C) is not the same as “shale oil” or tight oil. Every cash-flowing investor project you will encounter involves tight oil, produced via horizontal drilling and hydraulic fracturing. The Green River Formation’s trillion-barrel oil shale figures are geologically real but commercially irrelevant to your specific deal.
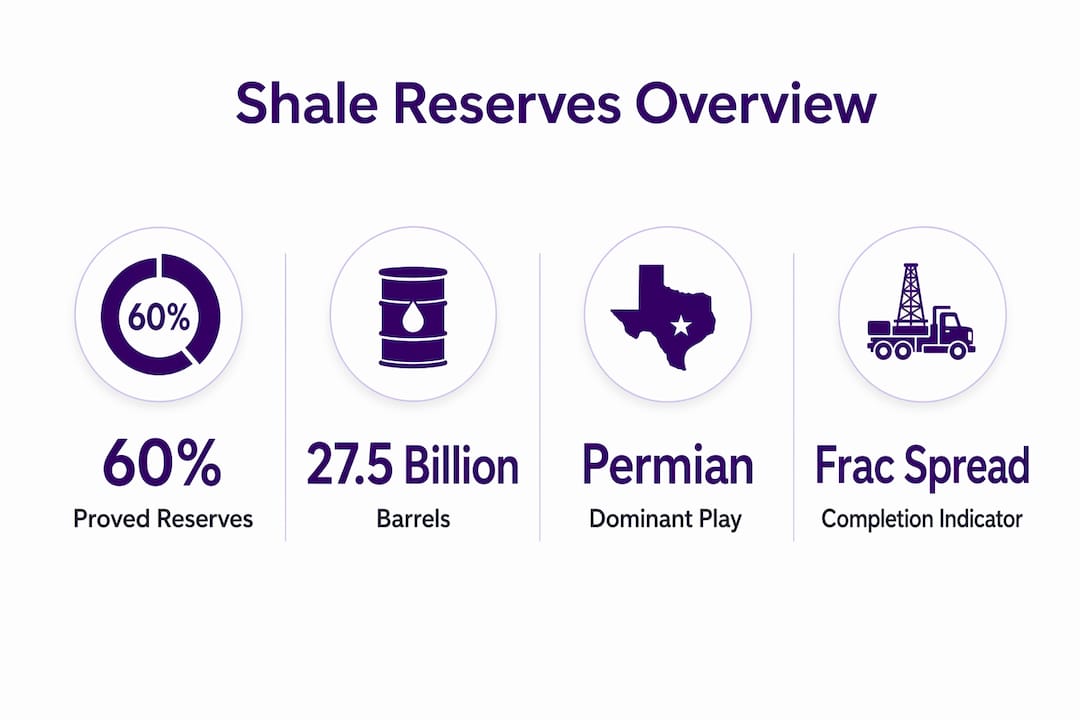
| Metric | Headline figure | Source |
|---|---|---|
| U.S. crude proved reserves from shale plays | ~60% of total; 27.5 billion barrels (year-end 2024) | EIA Proved Reserves Report |
| Tight oil share of U.S. crude production | ~64% of U.S. crude output (2023 estimate) | EIA FAQ |
| Permian Basin production | 6.6 million b/d in 2025; forecast ~13.7 million b/d total U.S. in 2026 | EIA |
| U.S. shale gas proved reserves | — | EIA Shale Gas Reserves |
Primary sources to bookmark: EIA’s annual proved-reserves report, USGS resource assessments, SEC EDGAR for 10-K and 10-Q filings, Kpler for production and DUC tracking, and peer-reviewed work published on ScienceDirect.
How reserve figures translate into project cash flow and tax timing
EUR and decline curves are where geology meets your return. A Permian well might produce 800–1,000 barrels per day in its first 30 days (IP30) and then decline 70–80% in year one. That steep curve means most of your cash flow, and most of your tax deductions, land in years one through three. A sponsor projecting flat production past year two without a refracturing plan deserves hard questions.
DUC inventory (drilled-but-uncompleted wells) is the metric most investors overlook. A sponsor with access to DUCs can reach first production in weeks rather than the six-to-twelve months a new drill requires, cutting your time-to-cash and reducing upfront capex exposure. Permian DUC inventory drew down roughly 32% from July 2025 to recent measurements, leaving approximately 783 DUCs in the basin. That drawdown compresses the pipeline of fast-to-cash projects.
Key reserve-derived metrics to request from any sponsor:
- IP30 and IP90 by well (not just a basin average)
- Type curve and EUR with the price deck used
- Year-one and year-two decline rate assumptions
- DUC count and completion schedule
- Breakeven oil price per well
Pro Tip: Watch frac-spread count, not just rig count. Frac spreads track completions, which drive near-term production. When frac-spread counts rise faster than rig counts, operators are burning through DUC inventory, which tightens the supply of fast-cash projects and can signal rising completion costs.
Which U.S. shale basins matter most for investor returns
Permian Basin (West Texas/New Mexico) dominates for a reason: it is oil-weighted, stacked with multiple productive formations, and backed by the most mature midstream infrastructure in U.S. shale. The catch is takeaway constraints. Pipeline capacity periodically tightens, widening the Midland-to-Cushing basis differential and cutting realized prices. Verify that any Permian deal has firm takeaway contracts, not just spot exposure.
- Eagle Ford (South Texas): Oil and condensate focus with lower breakevens in the core. Decline rates are steep but well understood. Good for investors who want near-term cash flow with a shorter production tail.
- Bakken (North Dakota/Montana): Oil-weighted but more exposed to crude-by-rail logistics and wider differentials. Strong operators with established acreage still generate solid returns; avoid deals in the basin’s fringe where well productivity drops sharply.
- Marcellus/Utica (Appalachia): Primarily natural gas and NGLs. Relevant for gas-focused investment strategies but subject to regional price basis risk and pipeline permitting delays. Tax profiles differ from oil plays.
- Niobrara/Denver-Julesburg Basin (Colorado/Wyoming): Oil and gas mix; regulatory environment in Colorado has tightened meaningfully, adding permitting risk that sponsors must address in their timeline assumptions.
- Anadarko/STACK (Oklahoma): Mature play with lower well costs but also lower per-well EURs. Works best for operators with large acreage positions and low overhead.
Technology trends that change what your wells actually recover
The ScienceDirect systematic review of U.S. shale development is direct on this point: recent production growth is driven more by technological refinements than by simply larger resource estimates. Three developments matter most to your investment thesis.
Cube development drills multiple wells simultaneously across stacked formations, sharing surface infrastructure and reducing per-well costs. Done well, it lifts EUR per acre. Done poorly, it causes parent-child well interference that permanently impairs productivity.

Refracturing restimulates existing wellbores at a fraction of new-drill cost. For a sponsor with aging wells, a refrac program can extend cash flow and reset depletion timing, which has direct tax implications.
U-shaped horizontal wells allow a single wellbore to drain acreage that previously required two separate laterals. The efficiency gain shows up in lower capex per barrel of EUR.
Operationally, wells-per-rig productivity has risen across U.S. shale, meaning a smaller rig fleet can still support growing output. That efficiency gain compresses unit costs but also means rig count alone is a poor proxy for production trajectory.
- Cube development: verify well spacing assumptions and parent-child interference mitigation in the operator’s completion design
- Refracturing: ask whether the sponsor’s EUR assumptions include or exclude refrac upside
- Completion efficiency: request wells-per-rig data and cost-per-lateral-foot trends from the operator
How to read reserve disclosures and spot reporting gaps
SEC filings are your ground truth. A company’s 10-K reserve disclosure must follow SEC rules: proved reserves use a 12-month average price, and PUDs must have a development plan within five years. When a sponsor’s marketing deck shows reserves materially higher than the 10-K, the gap is almost always PUDs or probable reserves being presented as proved. That is not fraud, but it is a risk you need to price.
A practical reserve data interpretation framework for evaluating sponsor materials:
- Pull the operator’s most recent 10-K from SEC EDGAR and compare proved reserves to the sponsor deck.
- Check the price deck used in the reserve report. A $90/bbl assumption in a $70 market inflates EUR and proved reserves.
- Verify the decline curve methodology. Are they using a hyperbolic decline with a realistic terminal decline rate, or an optimistic flat tail?
- Look for midstream arrangements. Undisclosed gathering agreements with volume commitments can subordinate your cash flow to pipeline fees.
- Ask whether a third-party reserve engineer (Ryder Scott, DeGolyer and MacNaughton, or similar) certified the figures.
Pro Tip: Compare the operator’s press-release IP rates to the SEC-filed type curves. Operators routinely cherry-pick their best wells for press releases. If the SEC type curve is 20–30% below the marketed IP30, that gap is your real baseline.
Tax considerations accredited investors should verify with a CPA
Oil and gas projects offer tax treatment unavailable in most other asset classes. The mechanics worth understanding before you sign:
- Intangible drilling costs (IDCs): typically 65–80% of well costs are IDCs, which may be deducted in the year incurred. For a high-income investor, this can offset a substantial portion of year-one tax liability.
- Tangible drilling costs: depreciated over seven years under MACRS, not deducted immediately.
- Depletion: percentage depletion (15% of gross income for independent producers, subject to limits) or cost depletion, whichever is greater. Percentage depletion can exceed your cost basis over time.
- Passive activity rules: if you are not a material participant, losses may be limited to passive income. Structure matters.
Tax outcomes in oil and gas depend heavily on project structure, your participation status, and your overall income picture. A CPA with oil and gas experience should review the sponsor’s tax memo and your personal situation before you invest. The deductions are real, but so are the rules that limit them.
Documents to request for tax review: the sponsor’s tax memo, a pro forma showing year-one deductible items, the partnership agreement, and a K-1 sample from a prior project.
For a quick estimate of your potential first-year deductions, the Fieldvest tax deduction calculator is a useful starting point before you engage a CPA.
Due-diligence checklist before you wire capital
Organize your diligence in this order: speed-to-cash items first, then legal and tax.
Technical and commercial:
- Operator track record: production history on prior wells versus type curve, not just marketing claims.
- Well-level IP30, IP90, and EUR with the price deck stated explicitly.
- DUC count and completion schedule, with milestones tied to capital calls.
- Midstream and takeaway contracts: firm capacity, term, and fee structure.
- Title and acquisition risk: confirm a title opinion covers the acreage.
- Royalty burdens and working interest: net revenue interest after all burdens.
Financial and legal:
- Pro forma cash flows with at least two price sensitivities ($55 and $70/bbl).
- Capital call schedule and any provisions for additional calls.
- Partnership agreement: waterfall, promote structure, and GP removal rights.
- Insurance: operator’s general liability and environmental coverage.
- Environmental reports: Phase I at minimum; Phase II if prior industrial use.
Understanding how operators structure and run projects is foundational before you evaluate any of the above. A sponsor who resists providing well-level data is telling you something important.
A simplified shale investment example
The numbers below are illustrative. Use them as a framework, not a forecast. Inputs should be replaced with actual sponsor data and verified against EIA production benchmarks.
| Input / Output | Assumption | Basis |
|---|---|---|
| Wells in program | 3 horizontal wells | Sponsor package |
| IP30 per well | 800–1,000 barrels per day | Basin type curve (Permian core) |
| EUR per well | — | Operator reserve report |
| Oil price (year 1) | $70/bbl | EIA short-term outlook baseline |
| Capex per well | — | Operator AFE |
| Operating cost | $15/bbl | Operator LOE estimate |
| Year-1 gross revenue (est.) | — | IP30 × price × working interest |
| IDC deduction (est.) | — | 65–75% of total capex, year 1 |
Sensitivity factors that materially shift IRR:
- A $10/bbl price move changes year-one net revenue by roughly 14–20% on a typical Permian well.
- EUR variance of ±20% (common in early-stage plays) shifts payback period by one to two years.
- DUC timing: completing a DUC versus drilling new can accelerate first cash flow by six months or more, improving IRR even if total EUR is identical.
Key Takeaways
U.S. shale reserves, concentrated in tight-oil plays like the Permian, offer accredited investors real cash-flow and tax-deduction potential, but only when operator quality and well-level economics hold up under scrutiny.
| Point | Details |
|---|---|
| Shale proved reserves scale | Shale plays account for ~60% of U.S. crude proved reserves; verify your sponsor’s figures against EIA year-end data. |
| DUC inventory matters | Permian DUC inventory drew down roughly 32% from July 2025 to recent measurements, leaving approximately 783 DUCs in the basin; ask for the operator’s DUC completion schedule. |
| Tax deductions are real but scoped | IDCs can cover 65–80% of well costs in year one; passive-activity rules and project structure determine what you actually deduct. |
| SEC filings are ground truth | Always reconcile the sponsor’s marketing deck against the 10-K reserve disclosure; price deck and decline assumptions drive the gap. |
| Fieldvest vets operators | Fieldvest connects accredited investors with operators who provide transparent well-level data, tax memos, and SEC-aligned reserve disclosures. |
Why operator vetting matters more than headline reserve numbers
The investors who get burned in shale deals almost never lose because the resource wasn’t there. They lose because the operator overstated EUR, buried a midstream fee in the partnership agreement, or used a price deck that required $85 oil to break even. The reserve figures from EIA and USGS confirm that the U.S. shale resource base is deep and productive. What they cannot tell you is whether the specific operator in front of you has the discipline to deliver on their type curve.
Fieldvest’s selection process focuses on operators with audited production histories, third-party reserve certifications, and tax memos prepared by qualified CPAs. The educational resources Fieldvest publishes, including guides on exploring U.S. oil investments and analyzing energy market trends, are built around the same diligence framework outlined in this article.
Vetted shale opportunities through Fieldvest
If the framework above describes what you want from a shale investment, and you’d rather not spend weeks sourcing and vetting operators yourself, Fieldvest is built for exactly that. Fieldvest connects accredited investors with U.S. oil and gas operators who have passed independent technical and financial review, and every deal comes with a tax memo so you and your CPA can model year-one deductions before you commit.

Use the free tax deduction calculator to estimate your first-year deduction potential, then visit Fieldvest to review current offerings. Consult your CPA and complete your own sponsor-level diligence before investing. The tax benefits are real, and so is the due diligence required to capture them.
Useful sources and next reads
Primary data sources:
- EIA Proved Reserves Report (year-end 2024)
- EIA FAQ: tight oil production and U.S. crude share
- EIA crude production outlook and Permian data
- USGS oil shale vs. shale oil distinction
- Kpler: U.S. shale growth and DUC dynamics
- ScienceDirect: shale technology and productivity review
- SEC EDGAR (10-K and 10-Q reserve disclosures): sec.gov/edgar
Fieldvest resources for deeper reading:
- Oil and gas investments guide for accredited investors
- How to evaluate oil projects for tax benefits
- High-yield energy investment examples
- How to lower your taxes with oil and gas investments
- Stock market context for energy allocation decisions
Recommended
- Gas Investments for Accredited Investors: 2026 Guide | Oil & Gas Investing
- Oil and Gas Investments: A Guide for Accredited Investors | Oil & Gas Investing
- Accredited Investor Opportunities: 8 Types for 2026 | Oil & Gas Investing
- Oil Reserves Data Interpretation Guide for Investors | Oil & Gas Investing

Get the Fieldvest Energy Brief
and AI-driven demand shifts — curated for accredited investors. Smart. Strategic. Tax-advantaged.