


The Midland differential is the price gap between crude oil sold at Midland, Texas, and the NYMEX WTI futures benchmark. Argus quotes WTI Midland as a differential to the relevant NYMEX light sweet crude futures settlement, so a Midland barrel is priced as “WTI plus or minus a few cents or dollars.” The related Midland-Cushing spread (often called Mid-Cush) is the same idea read the other way: how much Permian crude trades above or below crude at the Cushing, Oklahoma delivery hub. When the number is small, the Permian is moving oil freely. When it turns sharply negative, something is stuck.
This guide explains how the differential is built, what moves it, and how to read it if you own or are considering a stake in producing oil and gas assets.
TL;DR
- The Midland differential is the adjustment added to or subtracted from the NYMEX WTI futures price to get the price of Permian-quality crude at Midland, Texas.
- Mid-Cush is Midland minus Cushing. A wide negative number has historically signaled that pipelines out of the Permian were full.
- Since the Permian-to-Gulf Coast pipeline build-out, spreads have mostly been narrow, though they can still move when pipelines run near capacity.
- For an investor in a producing asset, the differential changes the price the operator actually receives, so it belongs in your underwriting next to the headline WTI number.
Table of Contents
- What the Midland differential measures
- How the Midland-Cushing spread is calculated
- What makes the differential widen or narrow
- How to read a positive or negative Mid-Cush
- Why investors in oil and gas assets should care
- Perspective: why we put the differential in front of investors
- Browse vetted energy projects
- Where to watch the number
- FAQ
- Sources
What the Midland differential measures
Crude oil in North America is not sold at one price. Buyers and sellers negotiate a differential, or spread, to the WTI futures contract, and that spread reflects differences in quality, transportation costs and regional supply and demand.
The NYMEX WTI futures contract is priced for delivery at Cushing, Oklahoma. Midland is roughly 500 miles southwest, in the heart of the Permian Basin. The Midland differential tells you what a barrel is worth at the Permian wellhead hub relative to that Cushing-based benchmark.
In plain terms:
- Positive differential: Midland barrels sell for more than the benchmark.
- Negative differential: Midland barrels sell for less than the benchmark.
- Near zero: Midland and Cushing are priced as if oil moves freely between them.
What “WTI Midland” actually is
Per Argus, WTI Midland is Permian-quality WTI sold for prompt-month physical delivery at the Enterprise and Plains terminals in Midland. The Argus assessment is the volume-weighted average of the day’s spot physical trades. Argus says it typically receives reports of more than 1 million barrels per day of prompt Midland-quality transactions each month, over 500 trades, so the number rests on a deep pool of deals.
The grade itself has become a global reference point. Industry commentary from REA aside, the practical proof is in the futures market: ICE lists a cash-settled future on the General Index Midland WTI assessment versus the ICE HOU diff, and ICE says its Midland WTI contract meets Platts Midland specifications accepted into Dated Brent.
How the Midland-Cushing spread is calculated
The arithmetic is simple subtraction:
Mid-Cush spread = WTI Midland price minus WTI Cushing price
Because WTI Midland is quoted as a differential to the NYMEX futures price, the Midland differential itself is very close to the Mid-Cush spread. A published benchmark such as a Midland-versus-Cushing cash formula makes this explicit: it assesses the Midland differential against a Cushing-based formula for Midland-quality WTI delivered at Midland, in U.S. dollars per barrel, with a daily assessment at the Chicago close.
A worked example
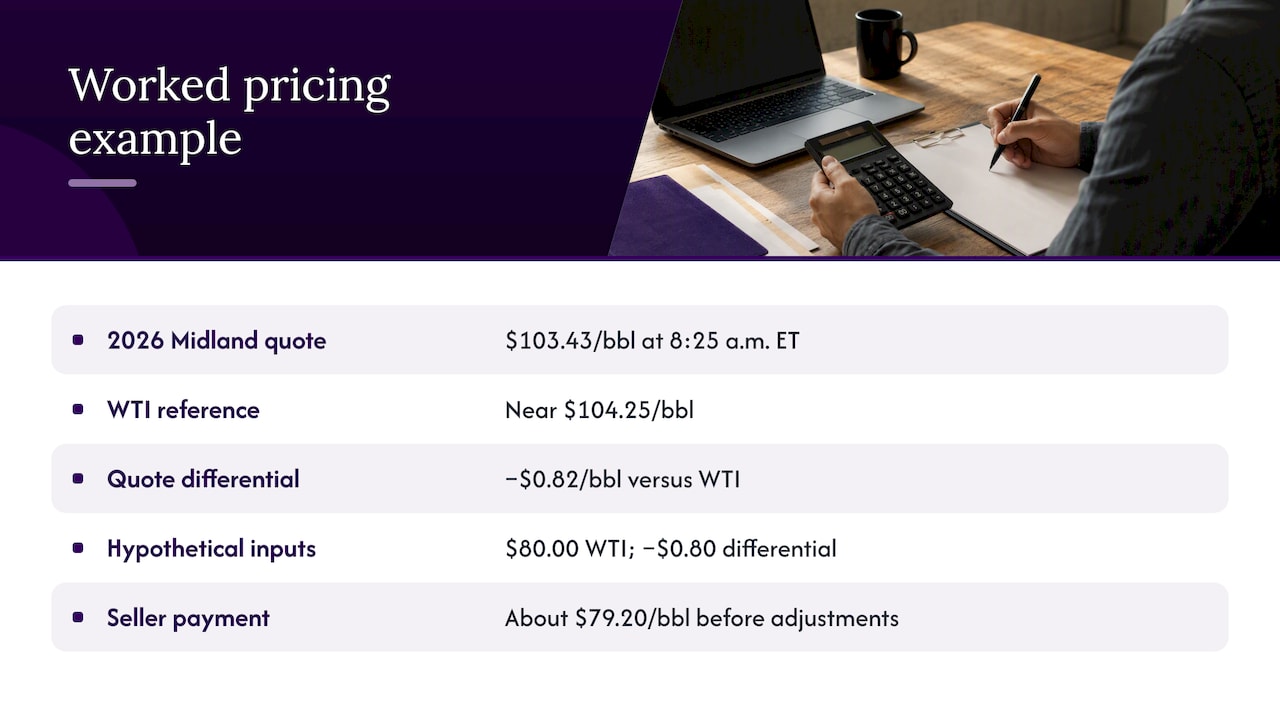
Prism reported that WTI Midland was $103.43 per barrel at 8:25 a.m. ET on October 16, 2026, which was $0.82 below WTI. Working backward, that implies a WTI reference near $104.25 and a Midland differential of negative $0.82. That is a snapshot from a single morning, not a forecast, and live quotes change by the minute.
Now the pricing side. Argus gives the formula a Midland seller can use with its assessments: NYMEX WTI calendar month average, plus the trade-month average Argus WTI differential to CMA, plus the trade-month average Argus WTI Midland differential. In round, hypothetical numbers: if the monthly average WTI were $80.00 and the average Midland differential were negative $0.80, a seller on that formula would be paid about $79.20 before any other adjustments in the contract.
Spot assessment versus futures
These are different instruments that readers often mix up:
| Instrument | What it is | What it tells you |
|---|---|---|
| Argus WTI Midland | Daily volume-weighted average of spot physical trades, quoted as a differential to NYMEX WTI | What physical barrels at Midland actually traded for |
| ICE Midland WTI (HOU) | A futures contract tied to Midland WTI delivery | A forward price you can hedge against |
| GX or similar cash formula | Daily assessment of Midland versus a Cushing formula | A transparent reference for settling swaps |
The spot assessment is a record of what happened. The futures and swaps are how producers and buyers lock in what will happen.
What makes the differential widen or narrow
Three forces do most of the work: pipeline capacity, quality and regional supply and demand. Of these, takeaway capacity is the dominant one.
Pipeline capacity: the main driver
When there is significant excess pipeline space between locations, spreads typically trade near variable cost, around 25 to 50 cents per barrel. Temporary disruptions tend to be absorbed without large moves. Higher utilization is what widens spreads and adds volatility.
The history shows how severe it can get. The EIA identifies a negative Midland-Cushing spread as a signal that Permian takeaway may be insufficient, and it reports that Midland traded at least $15 per barrel below Cushing at points in late 2012 and mid-2014. When production outruns local refining and pipelines, producers fall back on costlier rail and truck movements, and the discount is the price of that inconvenience.
The EIA saw it again later. Transportation constraints that developed in mid-2018 forced producers onto more expensive transport and lower received prices. By March 2019, the EIA noted Midland prices had become similar to Cushing prices, which suggested the Permian-to-Cushing constraints had largely been removed. Midland still sat below Houston, though, which pointed to continuing limits on shipping to the Gulf Coast.

The build-out that changed the picture
After the 2019 pipeline boom from the Permian to the Gulf Coast, CME reports the prompt spread between WTI Houston and WTI Midland has stayed within a narrow 40-cent range. Aegis added that the infrastructure wave from late 2018 to early 2020 brought roughly 2.5 million barrels per day of takeaway capacity, and that Mid-Cush settled between $0.00 and +$0.50 for much of 2020.
The sign can even flip. Aegis Market Insights reports Midland averaged a $2.74 per barrel discount to Cushing in 2017 to 2019, but a $1.21 per barrel premium in 2023, attributing part of that to Midland-to-Gulf Coast infrastructure and blending economics.
Quality and blending
Midland crude is light and sweet, with an API gravity of roughly 40 to 44 by industry convention. That quality is why it is wanted for export and why Houston-delivered Midland-quality oil has become a representative indicator of U.S. crude value, as ICE notes in its trading guide. Quality premiums and blending economics can move the number even when pipelines are not tight.
Regional supply and demand
Refinery outages, a swell of inventories at Cushing, export demand on the Gulf Coast and production surprises all shift the balance. CME’s market commentary stresses that differentials fold location, quality, transport and regional supply-demand conditions into one number around the Cushing benchmark, and that they are not a standalone crude price.
How to read a positive or negative Mid-Cush
A quick decision frame:
- Wide negative (several dollars or more): Permian barrels are struggling to leave the basin. Producers receive less per barrel, and trucking or rail costs rise. This is the 2012, 2014 and 2018 pattern.
- Slightly negative to flat: Normal conditions with ample takeaway. Spreads sit near the cost of moving the barrel.
- Positive: Midland is in demand relative to Cushing. This can reflect unused pipeline capacity out of the basin, a heavy Cushing inventory, or strong export pull.
- Rapid change in either direction: Look at pipeline utilization and recent maintenance or outage news before drawing a conclusion. One day’s move is rarely a trend.
Two cautions. First, the differential is only one layer of the price an operator realizes. Gathering, quality and marketing deductions in the contract come on top of it. Second, the Midland differential is a crude oil measure. Natural gas in the Permian has its own local pricing problem, which we cover in our Waha basis and pipeline delay playbook.
Why investors in oil and gas assets should care
If you hold a working interest or royalty in a Permian producing property, your revenue is roughly volume times the realized price. That realized price starts from a futures strip and then subtracts the differential. A reserve report priced off a flat NYMEX strip can overstate cash flow if the operator sells at Midland and the spread widens.
In practice, three habits help:
- Ask where the barrel is sold. Midland, Cushing, Houston and a gathering-point sale are different prices. The operator’s marketing arrangements tell you which one applies.
- Stress-test the spread. Run your projected cash flow with a normal differential, then with a wide one. If the investment only works in the narrow case, that is information.
- Understand how the forward curve is built. Our guide to the oil price strip, from the market curve to SEC reserves, shows how benchmark prices feed reserve estimates, which is where differentials get applied.
The same logic shapes the tax conversation. Deductions can make an energy investment efficient in year one, but the income that follows depends on realized prices. For a plain-language look at both sides, see our overview of private oil investments, tax and cash flow benefits, and our piece on what operators do in U.S. oil and gas projects, since the operator controls marketing.
Perspective: why we put the differential in front of investors
Most conversations about oil investing begin and end with the WTI headline. We think that is incomplete. A high-earning professional looking at a producing asset is buying a stream of barrels sold at a specific place, at a specific price formula, by a specific operator. The differential is where those details show up.
Our approach at Fieldvest is to present project materials in a form that lets investors compare deals side by side, and to work with vetted and screened operators. Marketing terms, the sales point and pricing assumptions are exactly the items we believe belong in that comparison. A deal that looks strong at the NYMEX strip but hides its basis exposure is not a stronger deal, only a less transparent one.
We would also say plainly that the differential cuts both ways. In a tight pipeline year it is a cost. In years with spare takeaway it can be a small premium. The right response is not to guess which year is coming but to diversify across asset types and to underwrite with conservative assumptions.
— Sharif
Browse vetted energy projects
If you are an accredited investor weighing producing assets, development projects or energy infrastructure, Fieldvest lets you review vetted U.S. energy deals and their key materials in one place. To see how a first-year deduction could change the math for your own situation, try our free oil and gas tax deduction calculator.
Where to watch the number
You do not need a trading terminal to follow the spread. A few practical routes:
- Daily spot quotes: price-reporting agencies publish the Midland assessment, and free aggregators show a delayed or snapshot version with the WTI reference.
- Futures curves: ICE and CME list Midland-related contracts, which show what the market expects the spread to be in coming months.
- Government commentary: the EIA’s Today in Energy series regularly explains Permian price moves in plain terms.
Whichever you use, note the benchmark and the timestamp. A Midland price of $103 means little unless you know it is quoted against WTI, at what time, and for which delivery month. For the wider industry context, our 2026 oil and gas industry guide is a good next step.
FAQ
What is the Midland differential in oil?
It is the price difference between WTI crude sold at Midland, Texas, and the NYMEX WTI futures benchmark, which is priced for Cushing, Oklahoma. Argus assesses it daily from spot physical trades. A negative number means Midland barrels sell below the benchmark.
What is the Midland-Cushing spread?
It is the WTI Midland price minus the WTI Cushing price. Historically, a wide negative spread signaled that pipelines out of the Permian were full. The EIA has documented Midland trading at least $15 per barrel below Cushing at points in 2012 and 2014.
Why would Midland trade above Cushing?
A positive spread can occur when takeaway capacity out of the Permian is underused, when Cushing inventories are heavy, or when Gulf Coast export demand pulls Midland-quality barrels. Aegis reported a 2023 average premium of $1.21 per barrel, partly tied to Gulf Coast infrastructure and blending economics.
Does the Midland differential affect my oil and gas investment returns?
Yes, if the operator sells at Midland or at a price formula tied to it. Your revenue is based on the realized price, which is the futures price adjusted by the differential and by contract deductions. Ask the operator where and how the oil is sold, and model both a narrow and a wide spread.
Sources
- Argus WTI Midland methodology
- Argus WTI differential to Nymex CMA
- Prism: WTI Midland price
- EIA: Permian region crude oil prices have increased
- EIA: New pipeline infrastructure should accommodate expected Permian growth
- Aegis: Permian to Gulf Coast crude pipelines nearing capacity
- Aegis: Mid-Cush spread rallies
- CME Group: Permian production and the WTI Midland forward curve
- CME Group: U.S. crude exports and NYMEX WTI
- CME Group on WSJ: Why crude pricing revolves around NYMEX WTI
- ICE: Midland into Brent trading guide
- ICE: Midland WTI vs HOU trade month future
- GX: WTI Midland vs Cushing cash formula factsheet
Recommended

Get the Fieldvest Energy Brief
and AI-driven demand shifts — curated for accredited investors. Smart. Strategic. Tax-advantaged.